INTRODUCTION AND USE CASE
In PowerBI we can’t select entire the column and see the number of rows in the table. To do this we have to export the data in excel and then we can do it by selecting the column.
In the scenario we have a table with different column and when I drag the columns in the table visual, I could see the values are grouped based on the selected columns. But when I try to find the number of rows on the grouped column then I got the actual problem.
The COUNTROWS() function works differently and doesn’t provided the expected result.
The Rank() function has different problem, either it got tied or when the values are filtered then it won’t provide the expected result.
POWERBI CONCATE ()
Using CONCATE function is best way to find the correct answer on getting the total number of rows in table visual.
Below steps are followed to achieve the total number of rows in table visual when applying filter as well.
- Use CONCAT() function with all possible combination of columns
- If the table has more than 2 possible combination, then use the & symbol in between the columns.
- Once the calculated column is created, then drag the column into the end of table value visual.
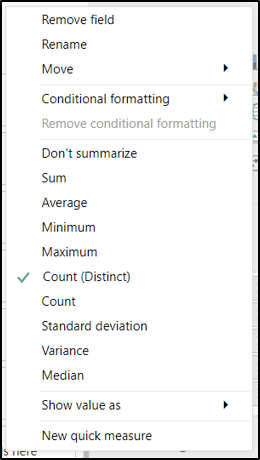
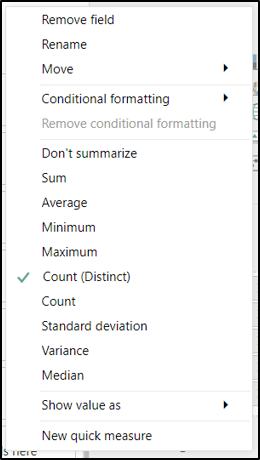
- Finally, change column value as Count(distinct) in value menu.
Sample Report Output:
The below report crated with the sample data which shows how to apply the logic.
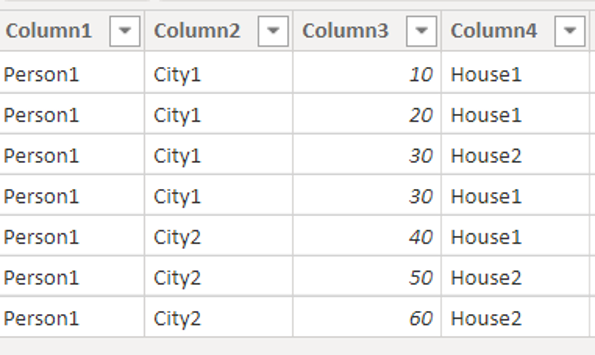
Person table:
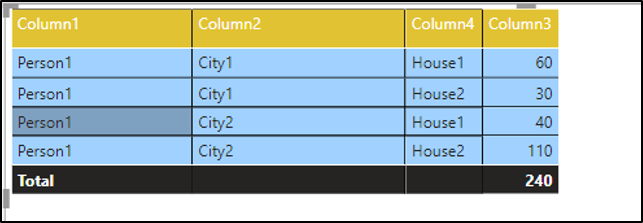
Report design:
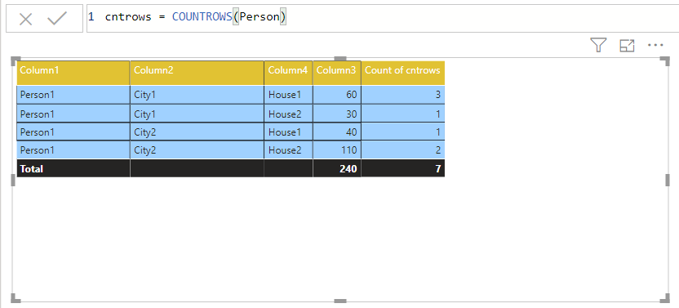
Negative Output 1: when using COUNTROWS() function – using Count
The expected output of total number of rows is 4.
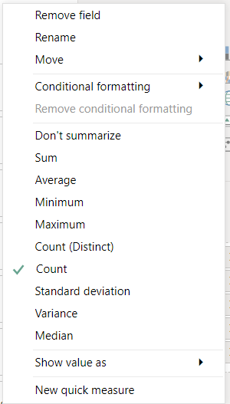
Negative Output 2: when using COUNTROWS() function – using Count (Distinct)
The expected output of total number of rows is 4.

Correct Output 1: when using CONCAT() function – using Count (Distinct)
The below output provides the correct expected value as 4.

Correct Output 2: when using CONCAT() function – using Count (Distinct)
The below output provides the correct expected value as 2 using filtered values.
Formula used for CONCAT():
Concat = CONCATENATE(Person[Column1]&Person[Column2],Person[Column4])
Conclusion:
This use case is mainly concerned about the total number of rows when the values are grouped and when filter applies so the CONCAT() function gives the exact expected output even when the filter applies. The same can’t possible by using RANK(), COUNTROWS() Or COUNT by column functions.


